
In this article I explore and compare 3 commercial tools that you can use to measure your website page speed. These tools also list issues that are slowing your page load speeds and provide recommendations to help address these issues.
I will be digging into:
Looking at what speed metrics these tools measure and how accurate they are. What features you get for free and what is paid as well as comparing the paid plans. Each of these tools is a little different so I will explain where it makes sense to use them. The following table is a quick summary comparison of these tools.
| Feature | WebPageTest | Pingdom | SpeedCurve |
|---|---|---|---|
| Free and paid plans | Free and paid options performance testing tool | Paid online performance and monitoring tool | Paid online performance monitoring tool |
| Test locations | Multiple locations around the world, including mobile devices at some locations | Multiple locations around the world | Multiple locations around the world including mobile devices at all locations |
| Test frequency | On-demand testing | Customizable monitoring frequency | Customizable monitoring frequency |
| Metrics measured | Load time, time to first byte, fully loaded time, page size, number of requests, waterfall view | Load time, page size, number of requests, waterfall view | Load time, page size, number of requests, waterfall view, user experience, performance budget |
| Performance recommendations | Yes, includes suggestions for improving performance | Yes, includes suggestions for improving performance | Yes, includes suggestions for improving performance |
| Integration with tools | Integrates with other tools like Google PageSpeed Insights, YSlow, and WebPageTest API | Integrates with other tools like Google Analytics and New Relic | Integrates with other tools like Google Analytics and New Relic |
| Real user monitoring | No | Yes, with the Real User Monitoring feature | Yes, with the Real User Monitoring feature |
| Cost | 300 Free Tests per month. USD $18.75 for 1000 tests/month | Starts at USD $10/month for basic monitoring, higher plans available. Additional $10/month for Real User Monitoring. | Starts at USD $12/month for basic monitoring, higher plans available. Plans can be customized based on need. |
Synthetic testing is also known as lab testing. In synthetic testing web site page speed is measured in an artificial environment. The advantage of this type of testing is the repeatability since many variables are controlled (I.e. device capabilities, web browser and connection speed). There are still some factors that will cause variance in the results such as internet routing, or other load on the test device. Being able to control variability allows you to test the impact of changes to a web page on performance. Because there can still be some variability in synthetic testing it is worthwhile running a number of synthetic tests to get an average result. WebPageTest runs a single test 3 times and provides a median result in the summary.
Real User Monitoring (RUM) is also known as field testing. In RUM testing page speed is measured as users interact with the web site. RUM testing requires instrumentation code to be added to site pages which has some impact on the speed results. RUM is useful because it gives you a better idea of what real users experience in loading your pages. Synthetic tests are limited to a select set of locations, devices and connection speeds, but RUM tests run on the actual devices, locations and connection speeds of users. RUM tests can be used for before and after testing but require large data sets to provide usable statistics.
Google emphasizes the following metrics
You can access Webpagetest at https://Webpagetest.org. This product has been around a long time and was recently acquired by Catchpoint Systems Inc. Webpagetest can be run against any page on your site. It uses Amazon AWS cloud infrastructure so you can test your site experience from global regions.
Webpagetest only provides synthetic testing. It can be triggered by Adhoc or through the WebPageTest API which each of your CI/CD automated releases. It offers a small variety of connection speeds, geographical locations and devices.
Webpagetest offers the following device and location options:
You can also have Webpagetest run a repeat view, which loads you page, closes and opens the browser and loads your page again to get a more accurate sample. Webpagtest can run Chrome's Lighthouse performance app which gives you Google Chrome specific analysis.
The following is an example report of a Webpagetest load of this site (tangenttechnologies.ca) on a Mobile 4G connection in Virginia.
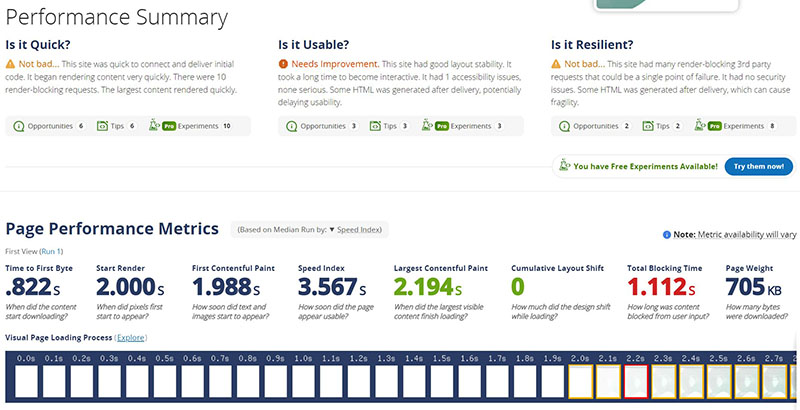
Webpagetest measures the following metrics and describes them as follows:
The speed metrics are not all named the same across tools and some metrics don’t correspond at all. Here is how WebPageTest and PageSpeed Insights match up:
PageSpeed Insights INP and TTFB metrics do not have a WebPageTest equivalent. INP could be equated with Total Blocking Time as both of these metrics describe how responsive the page is. However, INP includes responsiveness after page load.
TTFB measures how long each resource request takes to respond. WebPageTest does not measure TTFB, and PageSpeed does not measure the page total bytes downloaded that WebPageTest provides.
WebPageTest is a very useful tool for performance testing and it also does security and accessibility checks. It is a tool to use in addition to either Pingdom or SpeedCurve.
Pingdom is a website and server monitoring tool that tracks website performance and uptime. It uses advanced monitoring technology to detect any downtime or slow response times, alerting users in real-time through email, SMS, or push notifications. With Pingdom, users can also track website speed and performance metrics, analyze historical data, and generate customizable reports. Pingdom is easy to set up and offers a user-friendly interface, making it a popular choice among web developers, IT professionals, and business owners alike. Overall, Pingdom provides a reliable and comprehensive solution for monitoring website performance and ensuring maximum uptime.
Pingdom is owned by Solarwinds it offers both Synthetic and Real User performance monitoring. Pingdom offers a free ad hoc performance test utility at tools.pingdom.com. You can test your site from the following global locations:
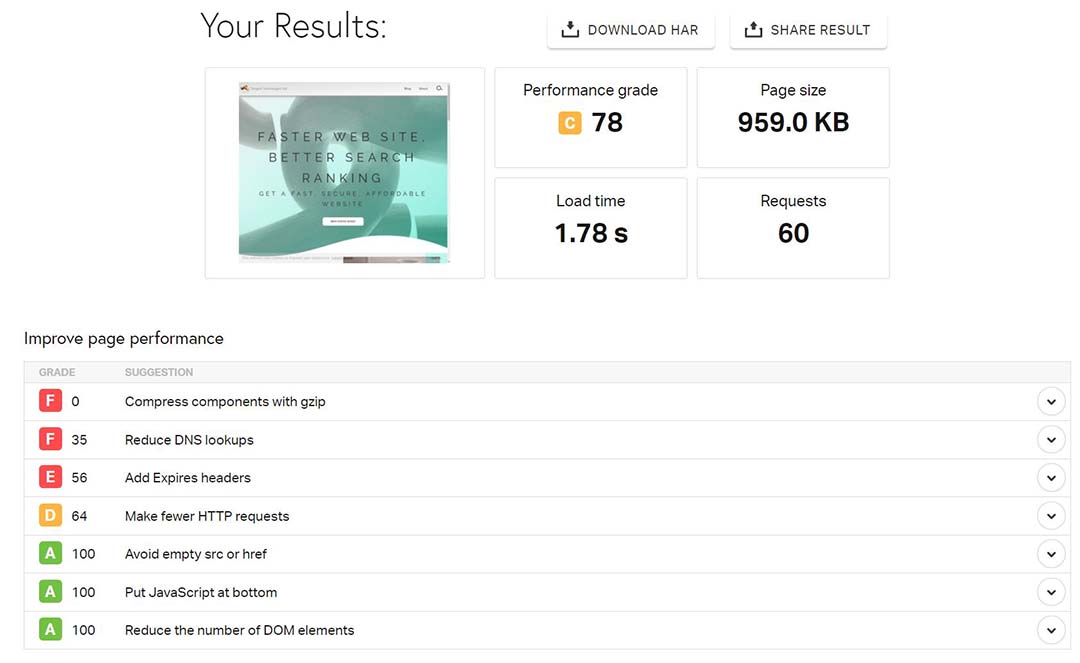
The Pingdom page speed tool measures the following:
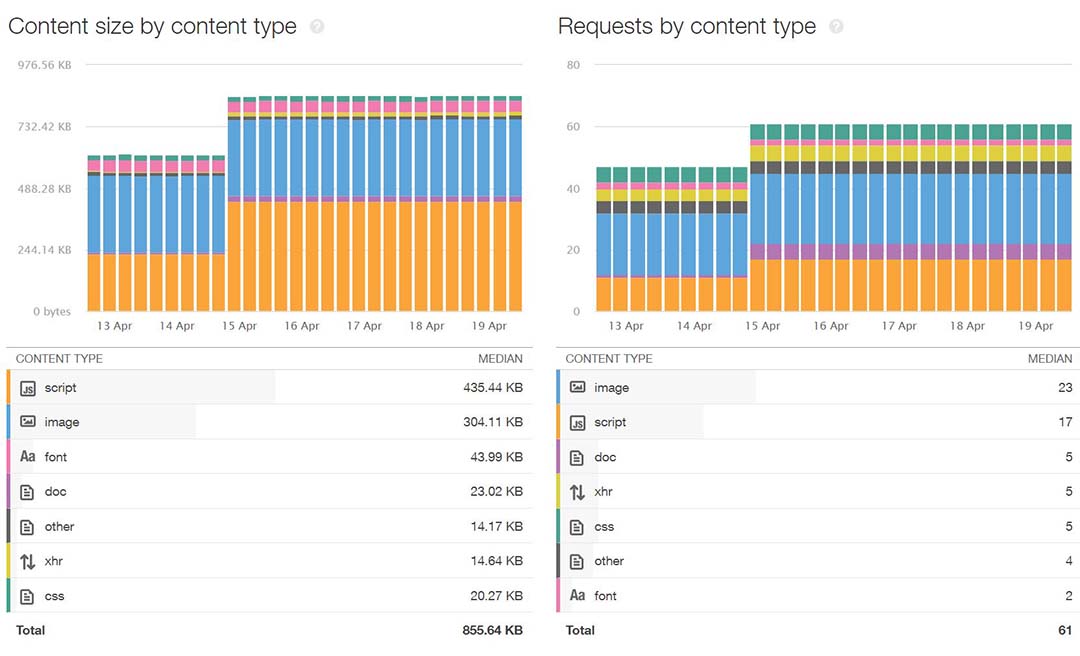
Pingdom also measures the byte size breakdown of the different types of assets that make up the page
It will also provide a list of recommendations and rank how well your page achieves these recommendations
The Pingdom synthetic test monitor is part of Pingdom’s full monitoring product. Solarwinds Pingdom monitoring tool provides the following synthetic monitoring features:
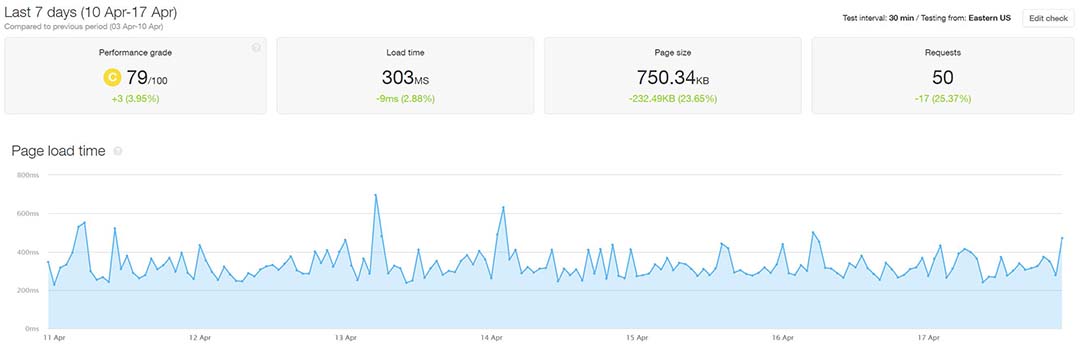
The pagespeed monitor is the one we are digging into in this review. Pingdom allows you to monitor 4 URLs. Pingdom will run a speed test against your URLs every 30 minutes and create a report. The report includes the metrics from the ad hoc performance tool
When setting up a monitor you will have to choose a test site to run the test. The test site locations are:
I like to choose a location that is the most distant from my server location. But you may want to run the same test from a few locations to get a general idea of the speed differences between sites.
It also graphs the history of the regular check and displays a loading timeline for all page assets with a breakdown and duration of the request steps. There is also a list of the recent speed tests and you can click into them to see the metrics from that specific test run.
Content download sizes and requests have a big impact on page load speed. Pingdom synthetic test measures the following:
Real User Monitoring (RUM) gives you field testing performance metrics. In order to capture metrics you need to add some javascript to your pages. The features that Pingdom RUM provides on the dashboard include:
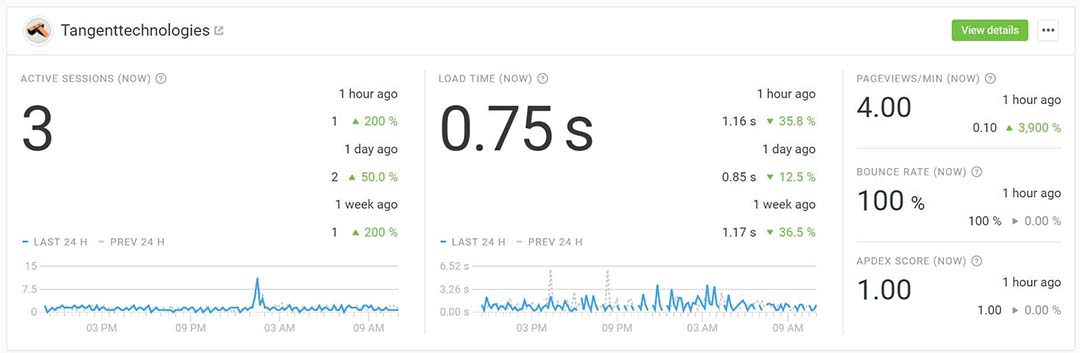
There are also detail views organized by “experience” or “performance”. The experience view provides:
The Performance view displays:
Pingdom’s real user monitoring helps shed light on where there might be issues in your site and how much these issues are affecting users. On a large web site it is unlikely you are going to run synthetic tests against every page on your site. Even if you did, synthetic tests are contrived and may not even represent the environment your users operate in.
Using pingdom RUM I noticed on my site that my articles on the Geany editor are popular in countries with slower connection speeds. This insight helped me prioritize the pages that need optimizing. Page speed is a function of the ‘weight’ of the page, size and cpu processing required to render it as well as the delivery infrastructure serving it.
By default Pingdom displays the metrics of its community site “THWACK”. This site gets far more traffic than my site and gives a much better data picture. Most the time my active session numbers are at zero or show “No Data”. This is a drawback for lower traffic sites.
Strangely enough the Pingdom marketing pages are quite mobile friendly but after logging into the app that seems the change. Most pages are too wide for the view port and require horizontal scrolling. I recommend holding your mobile device in landscape view to fix this.
SpeedCurve is a web performance monitoring and optimization tool designed to measure and improve website speed and user experience. It provides real-time monitoring of website performance metrics, including page load times, speed index, and other key performance indicators. SpeedCurve also offers advanced features such as filmstrip view, video capture, synthetic testing and real user monitoring, enabling users to see exactly how their website performs across different devices and locations. With its intuitive dashboard and powerful reporting capabilities, SpeedCurve provides users with actionable insights to optimize their website for better performance and user experience. Overall, SpeedCurve is a comprehensive solution for web performance monitoring and optimization, making it a popular choice among web developers, IT professionals, and business owners who value fast and reliable websites.
Speedcurve is a more specialized product than Pingdom. It only measures page speed. It offers the following Synthetic monitoring features:
The Speedcurve test locations list is:
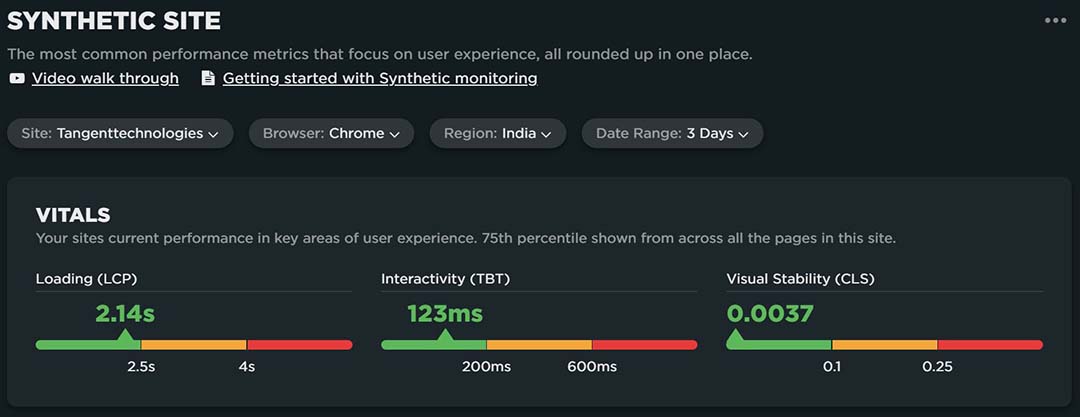
The Speedcurve Synthetic monitor measures the following as the “Vitals”
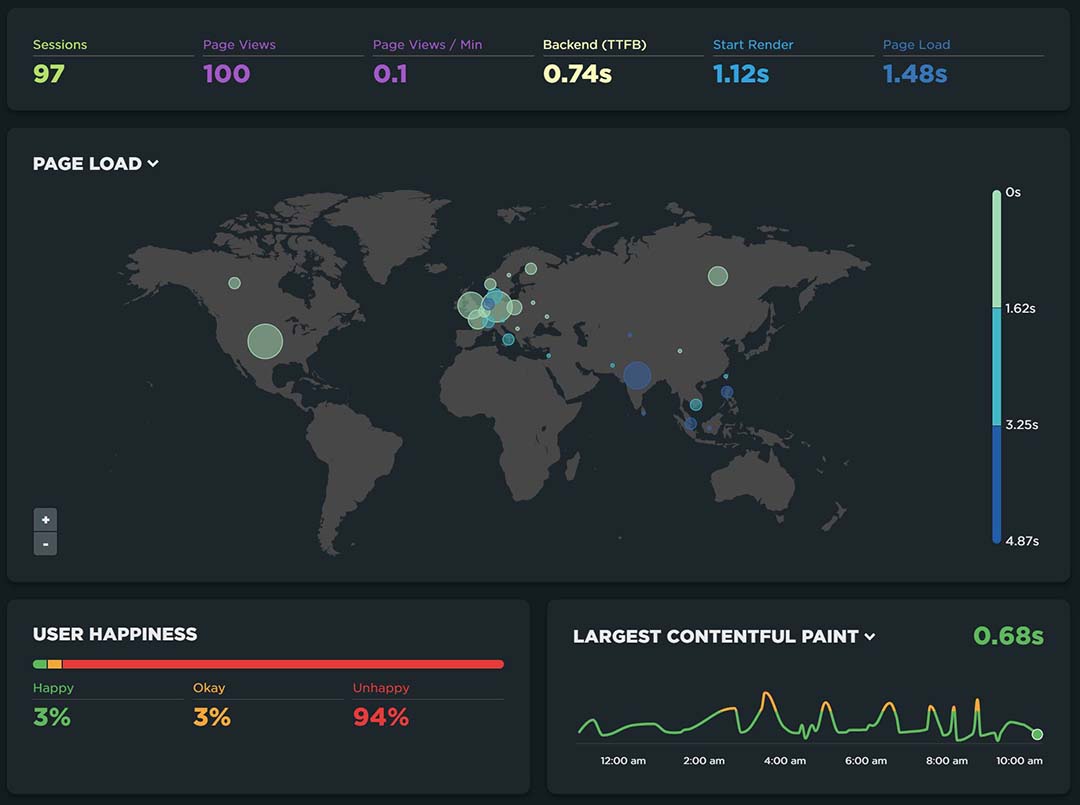
It then reports on the “Paint” stages in the page load
Start Render
The measures are each graphed over time so you can see the trend. This breakdown reveals opportunities to make changes that will improve load times. For example, for the Tangent Technologies site, there is almost 4 seconds of time elapsed between the start render and the page being fully loaded on the Samsung S4 in India. Like Pingdom, SpeedCurve measures the number of requests and the request size by content type to help you see what is causing performance issues.
SpeedCurve Real User Monitoring (RUM) also requires adding javascript code to all your web site pages. The RUM reports include:
The Live report can be filtered to show data from the last 15mins, 30mins, 1hour, 3hours or 12hours and displays the following based on the time range selected:
The sessions report has the following sections:
The compare report compares the mobile experience on your site against the desktop experience. Mobile and Desktop are compared on the following:
The metric comparison defaults to a ‘distribution’ comparison which shows you how many page views are experienced at different speeds but also allows you to compare by time of day, browser, page label, location, connection type, device memory, device type and viewport. These views help isolate where performance problems are occurring and what the cause may be.
The User report shows the bounce rate vs page speed view. Users typically do not wait for slow pages, and this report makes that very clear. It gives you an idea of how much clicks are resulting in bounces and what your page speed target should be. I believe users are willing to wait longer for some pages and not as long for others and using a generic 2 second load time metric may not be enough.
The user report is broken down into the following graphs:
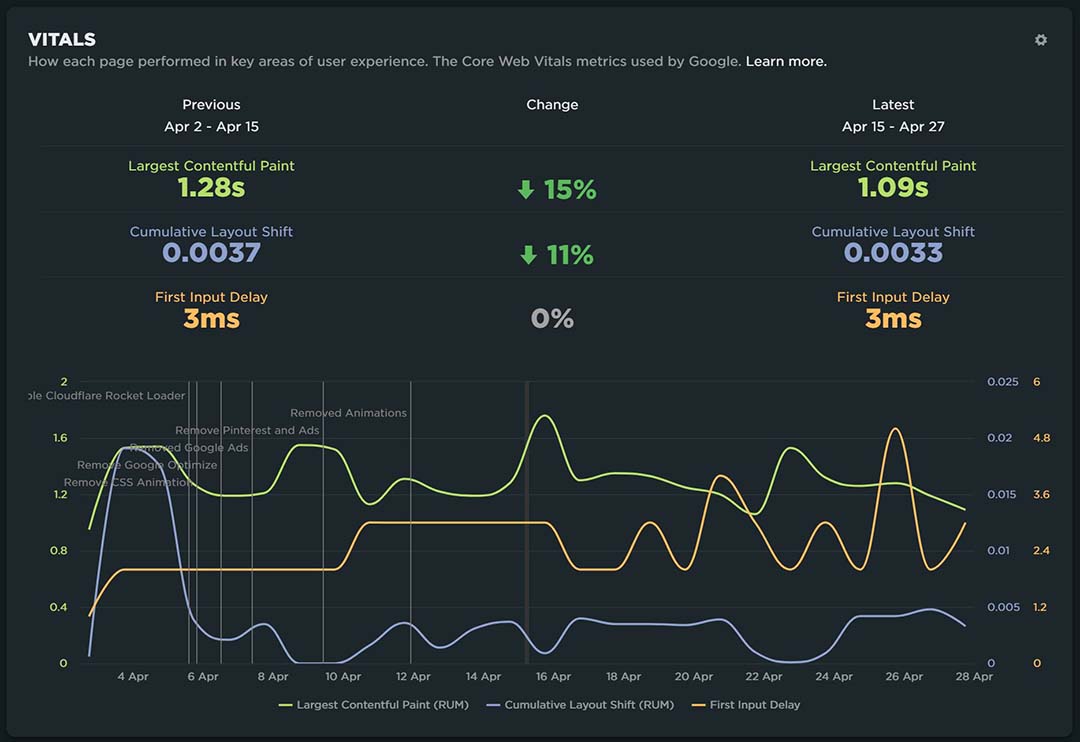
If you use the deploy feature and label changes to your site when the changes are made, the above report will overlay those events so you can see how they impact your user experience.
Upon looking at the User report and the session and page view reports I wonder if I truly need Google analytics on my site. The Google scripts are identified as having a large impact on the speed of the site. There is value in Google Search Console, which also uses my Google tracking tag and I would lose this insight, but SpeedCurve provides enough analytics insight that I would consider dropping Google analytics.
The performance report includes:
The design report compares page design assets like JS and CSS against performance. The report includes:
The SpeedCurve RUM Javascript report shows:
The breakdown reports provide good insight into which pages are struggling and where there may be opportunities to improve them.
The SpeedCurve Javascript report has a section on Javascript errors but there is a full report dedicated to JS errors. This report includes
Javascript Errors - Same graph found on the Javascript Report
Error Categories - Errors by error message, browser, page label and by script
Recent Errors - List of most recent errors, browser, path and script causing the error
This report is a simple list of pageviews, with the time, country, city, browser and page label
Webpagetest, Pingdom and SpeedCurve offer site performance measurement and testing simulating traffic from global locations. They provide insights into how page speed performance can be improved and recommendations for improvements.
Webpagetest only provides ad hoc, synthetic performance tests where Pingdom and SpeedCurve offer synthetic test monitors as well as Real User Monitoring (RUM). Webpagetest can be integrated into a deployment pipeline so it can be used to monitor at deployment intervals.
Pingdom is primarily designed for uptime monitoring and has additional performance features. Pingdom's synthetic and Real user monitoring tools are a nice addition to it's monitoring capability, but are limited.
SpeedCurve is primarily designed to measure site performance and does not have site outage monitoring and alerting features. SpeedCurve is a highly capable tool to measure and identify performance issues and opportunities in your web site. Its Synthetic and Real user monitoring reporting is extensive and highly customizable.
Related Articles
See how to limit the size of media files in Sitecore
See how to create fast static website in Azure
Photo by Jan Ivo Henze on Unsplash